CAPE-tivating Predictions: Small Caps Ready to Outshine in a Pricey Market?
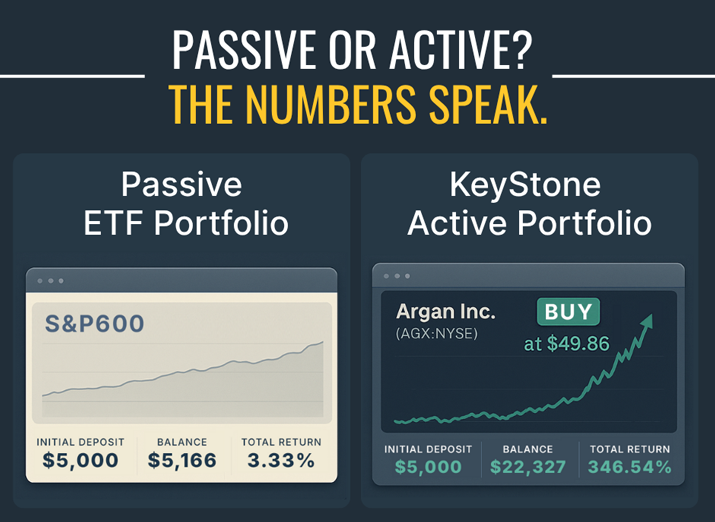
Synopsis: Despite higher relative valuations in the broader market based on the current elevated Cyclically Adjusted Price-Earnings (CAPE) ratio of 37.81 (significantly above historical averages), quality small-cap stocks may present a compelling investment opportunity. This is due to their current substantial valuation discount compared to large-cap stocks (S&P 600 forward P/E of 15.8 vs. S&P 500’s 22.48), historical under ownership, and potential tailwinds from lower interest rates and reshoring trends. Near-to mid term, it appears to be a “stock picker’s market” where identifying high-quality, fundamentally strong small and mid-cap companies can yield significant long-term returns. Recent examples include U.S small cap “picks & shovels” play on AI and Electrification, Argan Inc. (AGX: NYSE) which jumped 346.54% on record earnings. And unknown, profitable micro cap, Pro-Dex Inc. (PDEX: NASDAQ), which we recently recommending selling half original positions 18-months later at $52.52 with the shares up 180%.

Understanding the Cyclically Adjusted Price-Earnings (CAPE) Ratio
One metric we utilize internally and quote to clients as a broad gauge of current market valuations is the CAPE ratio, also known as the Shiller PE. It is a valuation metric popularized by American economist Robert Shiller. Unlike the traditional trailing 12-month PE ratio, which can be distorted by short-term earnings fluctuations, the CAPE ratio smooths out cyclical effects by dividing the current price of an index (e.g., S&P 500) by the 10-year average of its inflation-adjusted earnings. This methodology provides a more stable and long-term view of market valuation, making it a valuable tool for forecasting potential future returns and evaluating the current valuations in a historical context. Historically, a higher CAPE ratio has correlated with lower returns over the subsequent decade or two, as the ratio tends to revert to its mean.
Current S&P 500 CAPE Ratio in Historical Context
As has been the case for the majority of the past decade, the S&P 500 CAPE ratio remains significantly elevated when compared to its historical averages. As of mid July 2025, the Shiller PE on the S&P 500 is 37.81. This value represents an increase from 35.2 two months ago and 34.8 one year ago, indicating continued upward movement in broad market valuation.
For historical context, the recent 20-year average for the Shiller PE ratio is 27. The current CAPE of 37.81 is approximately 40.04% higher than its 20-year average. The all-time average (over 100 years) for the Shiller PE is 17.6. The current CAPE is approximately 114.83% above its all-time historic average.
| Metric | Value (as of July 15, 2025) | Comparison to Averages |
|---|---|---|
| S&P 500 CAPE Ratio | 37.81 | 40.04% higher than 20-year average (27); 114.83% higher than all-time average (17.6) |
| S&P 500 Forward 12-Month P/E Ratio | 22.48 (for Q4 2026 earnings) | Above 5-year average (19.9) and 10-year average (18.4) |
| S&P 600 Forward P/E Ratio | 15.8 | – |
| Mega-Cap (Magnificent 7 Average) Forward P/E Ratio | ~28 | – |
| Large-Cap (S&P 500) Premium over Small-Cap (S&P 600) | 42.28% | Widened from ~36.7% in Fall 2023 |
Implications of Current CAPE Levels for Future Market Returns
The current CAPE ratio is not only significantly above its recent 20-year average but also exceeds its long-term historical arithmetic mean of 17.6 by well over 100%. This significant deviation implies that, based on historical patterns, the broad market could be considered overvalued. The core principle of the CAPE ratio is its inverse correlation with future long-term returns: a higher CAPE suggests lower returns over the next one to two decades. This indicates that investors should adjust their long-term return expectations for the broad US equity market downwards. Relying solely on passive index strategies such as index ETFs or funds in such a high CAPE environment may lead to subdued real returns over a multi-year horizon, necessitating a more discerning approach to portfolio construction.

We suggest that the U.S. stock market is currently firmly positioned as a “stock pickers” market.
The persistent elevation of the CAPE ratio has naturally led to discussions about whether structural changes in the economy, such as sustained low interest rates, the technological dominance of a few large firms, or efficient capital allocation, justify a “new normal” of higher valuations. However, the CAPE’s historical predictive power and its consistent tendency to revert to the mean suggest that such extreme deviations are historically temporary.
| Metric | Value (as of July 15, 2025) | Comparison to Averages |
|---|---|---|
| Current CAPE Ratio | 37.81 | – |
| Recent 20-Year Average | 27 | Current is 40.04% higher |
| All-Time Average (Arithmetic Mean) | 17.6 | Current is 114.83% higher |
| Mega-Cap (Magnificent 7 Average) Forward P/E Ratio | ~28 | – |
| Implied Future Annual Market Return | ~2.1% | – |
Current Forward PE Valuations Across US Market Capitalizations
Overview of Forward PE Ratios
We often quote the forward PE ratio on markets and in reference to individual stocks. It is a widely used valuation metric that divides a company’s or index’s current share price by its estimated future earnings, typically over the next 12 months. This metric offers a forward-looking perspective on how much investors are willing to pay for expected earnings, thereby providing insights into prevailing market sentiment and growth expectations. It is a critical tool for assessing whether a security or market segment is overvalued or undervalued relative to its anticipated profitability.
Historical Context of the Valuation Gap
As we have detailed in a number of commentaries and client webinars over the past 2 plus years, the current valuation gap between small and microcap stocks offers a potential opportunity. To put this in context, for the better part of the past 25 years, small-cap stocks were generally recognized for their higher growth potential and, as a result, historically commanded a premium in their PE multiples relative to their large-cap counterparts. This long-standing trend inverted in recent years, leading to the current valuation disparity where large-cap stocks trade at a premium.
Just under three years ago, in November 2023, when we began noting the preferential pricing of small-caps vs. large-caps, the S&P 500 (representing US Large Caps) traded at a forward PE of 17.4, while the S&P 600 (representing Small Caps) was at 11.5. This indicated a substantial premium of greater than 50% for large caps over small caps.
Access KeyStone’s 2025 Cash Investment Product Report
Explore the safest, highest-yielding places to hold excess cash—ISAs, T-Bills, GICs, and more—all available inside your brokerage account.


Updated Forward PE Ratios for US Market Capitalizations
Recent data provides an updated snapshot of these valuation metrics across various market capitalization segments:
S&P 500 (Large Cap): The forward 12-month P/E ratio for the S&P 500 is currently 22.48 as of July 15, 2025, with this figure reflecting the estimate for Q4 2026 earnings. This current valuation stands above its 5-year average (19.9) and 10-year average (18.4), indicating that large-cap stocks, on an absolute basis, remain relatively expensive compared to their recent historical valuations.
S&P 600 (Small Cap): The S&P 600 Index currently trades with a forward price-to-earnings (PE) ratio of 15.8, citing Yardeni Research. Vanguard’s S&P SmallCap 600 Value Index also reported a P/E ratio of 15.2x.
Mega-Cap: The “Magnificent 7” stocks, often considered a proxy for the most dominant mega-caps, sport an average forward P/E ratio of approximately 28.
| Metric | Value (as of July 15, 2025) |
|---|---|
| S&P 500 (Current Forward PE) | 22.48 |
| S&P 500 (5-Year Average) | 19.9 |
| S&P 500 (10-Year Average) | 18.4 |
| S&P 600 (Current Forward PE) | 15.8 |
| Mega-Cap (Magnificent 7 Average Forward PE) | ~28 |
Comparative Analysis: The Evolving Small-Cap vs. Large-Cap Valuation Gap
Comparing the updated S&P 500 forward PE of 22.48 with the S&P 600 forward PE of 15.8 reveals that large-cap stocks still trade at a significant premium of approximately 42.28% ((22.48 – 15.8) / 15.8 * 100). While this premium has narrowed slightly from the “greater than 50%” we observed in Fall 2023, it remains a substantial deviation from the first ~20 years of this century where small caps traded at a premium. This sustained, albeit slightly reduced, premium for large caps indicates that the underlying market dynamics favoring large-cap outperformance, such as concentrated growth and perceived safety, continue to exert influence, preventing a full mean reversion to historical small-cap premiums. The narrowing suggests some re-evaluation or rotation within the market, but the fundamental imbalance persists. The continued valuation discount in small caps implies the opportunity to position clients in high quality undervalued small caps remains.
Implications and Potential Opportunities
Strategic Considerations from the Valuation Gap (Small vs. Large Cap Stocks)
The persistent valuation gap between large-cap and small-cap stocks continues to present a compelling opportunity for investors seeking relative value. Given that small-caps are trading at a significant discount to large-caps, a potential reversal to historical norms (where small-caps commanded a premium) could unlock substantial upside. This opportunity is particularly pronounced in “high quality, profitable small-caps”. Within our U.S. Small-Cap Research, we endeavour to replicate past success by identifying unique opportunities in high quality lesser-known names including ![]() Argan Inc. (AGX: NYSE). Over the past 15 months, AGX has been a homerun “picks & shovels” recommendation on electrification/data centers from our U.S. Small-Cap Discovery Research. The stock is now up 346.54% from our original BUY at $49.85 in March of 2024. Or
Argan Inc. (AGX: NYSE). Over the past 15 months, AGX has been a homerun “picks & shovels” recommendation on electrification/data centers from our U.S. Small-Cap Discovery Research. The stock is now up 346.54% from our original BUY at $49.85 in March of 2024. Or ![]() Pro-Dex Inc. (PDEX: NASDAQ), an unknown U.S. small-cap recommended at $18.75 in June 2023 which we sold half our position 18-months later at $52.52 with the shares up 180%. These unique recommendations illustrate the potential for significant returns when identifying fundamentally strong small companies at attractive valuations.
Pro-Dex Inc. (PDEX: NASDAQ), an unknown U.S. small-cap recommended at $18.75 in June 2023 which we sold half our position 18-months later at $52.52 with the shares up 180%. These unique recommendations illustrate the potential for significant returns when identifying fundamentally strong small companies at attractive valuations.
| Company (Ticker) | Recommendation Price | Recommendation Date | Current Price (July 15, 2025) | Total Return |
|---|---|---|---|---|
| Argan Inc. (AGX) | $49.85 | March 2024 | $222.60 | 346.54% |
| Pro-Dex Inc. (PDEX) | $18.75 | June 2023 | $45.18 | 141.97% |
Note for PDEX: Half of the position was sold at $52.52, yielding a 180% return on that portion.
Considerations for Portfolio Allocation Given Broad Market Valuation Signals
The elevated S&P 500 CAPE ratio (37.81 vs. historical average of 17.6) suggests that broad market returns over the next decade or two may be significantly lower than historical averages. This implies that a purely passive, indexing approach to the S&P 500 might yield subdued returns. To mitigate this risk and seek better long-term performance, investors should consider identifying unique opportunities down market. This could involve increasing exposure to relatively undervalued segments like small to mid caps. We caution that small caps should not be the sole focus of a broader portfolio which should still include quality profitable and growing larger cap names, but the exclusion of the latter group may be particularly detrimental to returns over the next decade. A focus on high-quality companies, regardless of market capitalization, is also advisable in any market conditions.
Revisiting Catalysts for Small-Cap Outperformance
In recent small cap commentaries, we have included several additional factors that reinforce the potential for outperformance:
Under owned Status: Presently, the percentage of the US stock market that is small cap by market capitalization is relatively low compared to historical averages. According to Neuberger Berman, the weighting of small-cap stocks as a proportion of overall equity market capitalization is currently around 3.1%, which they note has rarely been this low over the past 100 years. There is significant historical data to support the idea that when the total U.S. small-cap market capitalization was below 5% of the total U.S. equity market capitalization, small caps have tended to outperform large caps. This structural under ownership implies significant room for capital re-allocation, which could fuel future outperformance.
Lower Interest Rates: A potential shift towards lower interest rates provides a direct tailwind for small caps by reducing their cost of capital and potentially expanding their valuation multiples.
Reshoring Trend: The ongoing trend of bringing manufacturing and supply chains back to the U.S., driven by geopolitical factors and government incentives (CHIPS Act, Inflation Reduction Act, tariffs), can continue to benefit domestic small-cap companies with localized operations.
A significant portion of the S&P 500’s current valuation and performance is concentrated in a few mega-cap technology companies, often referred to as the “Magnificent 7.” These stocks trade at a particularly rich forward P/E ratio of around 28, significantly higher than the broader S&P 500’s average. While they are expected to deliver solid earnings growth (17% for 2025 versus 7% for the rest of the S&P 500), this concentration creates a systemic risk for the cap-weighted S&P 500. If the mega-cap group experience a correction, it could disproportionately impact the overall index. Allocating to relatively undervalued small-cap stocks offers a compelling way to diversify away from the concentration risk inherent in the mega-cap-dominated large-cap indices. This strategy allows investors to capture potential upside from a relatively undervalued segment of the market, less influenced by the valuation extremes of the largest companies, thereby improving portfolio resilience and long-term risk-adjusted returns.
| Category | Total Market Capitalization (Trillions USD) | Percentage of S&P 500 |
|---|---|---|
| Magnificent 7 (Combined) | $18.42 | 33.07% |
| Other 493 S&P 500 Stocks | $37.28 | 66.93% |
| Total S&P 500 | $55.70 | 100.00% |
Conclusion
The current US equity market presents an interesting picture: a broad market (S&P 500) that appears historically expensive based on the CAPE ratio, suggesting tempered long-term return expectations, juxtaposed with a significant relative valuation opportunity in the small-cap segment (S&P 600). The persistence of the large-cap premium over small-caps, coupled with the under owned status of small-caps and favorable macroeconomic tailwinds including potential lower interest rates and reshoring, reinforces the investment thesis for strategic allocation to high-quality small-cap companies. In an environment characterized by elevated valuations and concentrated market leadership, a strategic focus on higher quality Canadian and U.S. micro to mid cap stocks with relative value and fundamental strength, should provide KeyStone clients with a long-term advantage over the next decade.
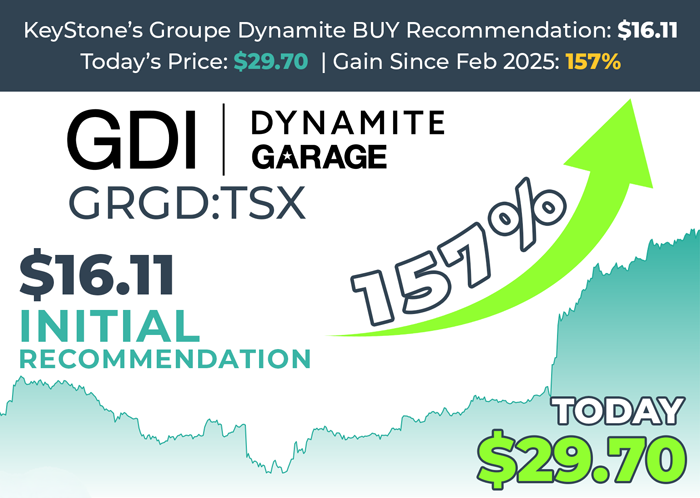
Proof is in the results: KeyStone’s successful track record of identifying unknown, great Canadian (& U.S.) stock has continued into 2025 as recent top BUY, Groupe Dynamite (GRGD:TSX), has jumped 157% in the past 2 months and is one of the best (top 2) performing stocks on the entire Toronto Stock Exchange over the past month.
The 157% gain on Groupe Dynamite Inc. could have already paid for your subscription well over 10x in less than three months.
- $2,000 invested in Groupe Dynamite less than 3-months ago is worth $5,133 today.
- $20,000 is worth $51,336 today.
What are you waiting for?
Let us help you build a winning stock portfolio today.
We recently released 4 new profitable U.S. Small-Cap BUYs – get your copy of our U.S. Small-Cap Special Report today!
