The PEG Ratio Decoded: Your Secret Weapon for Finding Undervalued Growth Stocks
Imagine your scanning the market for your next great stock, and you find two compelling companies. Stock A trades at a P/E ratio of 15, while Stock B has a P/E of 30. Your instinct might say Stock A is the better value—but what if Stock B is growing its earnings at 30% while Stock A is struggling to achieve even 5% growth? This is where the PEG ratio becomes your secret weapon; it allows you to measure the value of a stock while also factoring it its growth rate.
The Price/Earnings-to-Growth (PEG) ratio is a key metrics for Growth at a Reasonable Price (GARP) investing—a strategy that targets the sweet spot between attractive growth and reasonable valuations. While growth investors often overpay for trendy stocks and value investors often end up with lower quality companies, GARP investors look to find companies that are delivering solid growth without the premium price tag. An important tool in this pursuit is the PEG ratio.
Understanding the PEG Ratio Fundamentals
The PEG ratio formula is simple: P/E Ratio ÷ Annual Growth Rate of EPS = PEG Ratio. Yet within this straightforward calculation lies powerful insight into a stock’s true value proposition.
The strength of the PEG ratio is in its ability to compare valuation against growth. A stock with a P/E of 25 might seem expensive until you discover it’s growing earnings at 30% annually, resulting in a PEG ratio of 0.83—potentially indicating an undervalued opportunity. Whereas a stock with a PE of 10 might seem cheap until you discover that earnings are growing at only 5% giving it a PEG ratio of 2.0.
The magic number that most GARP investors look for is a PEG ratio below 1.0. Peter Lynch, the legendary Fidelity manager who popularized this ratio, argued that a fair price for a growth stock was a PEG ratio of 1.0, making anything below that threshold potentially undervalued.
The PEG ratio’s superiority over the P/E ratio alone becomes evident when comparing stocks across different growth phases. A mature utility company might sport a P/E of 12, appearing cheap, but with 2% growth, its PEG ratio of 6.0. Meanwhile, a technology company with a P/E of 20 and 25% growth delivers a PEG of 0.8, indicating superior value despite the higher P/E ratio (assuming growth is maintained).
Practical Application: Using PEG for Stock Screening
Implementing PEG ratio analysis in your investment process requires a systematic approach that goes beyond simply seeking the lowest ratios. Effective GARP screening combines PEG analysis with additional quality metrics to identify truly compelling opportunities.
Start with basic screening criteria: Begin by filtering for stocks with PEG ratios below 1.5 (or 2.0), providing a buffer above the ideal 1.0 threshold while capturing genuinely attractive opportunities. This initial screen is intended to eliminate overvalued growth stocks while preserving companies with reasonable growth-to-price relationships.
Layer in quality metrics: Combine your PEG screen with fundamental quality indicators. Look for companies with consistent earnings growth over the past three to five years, demonstrating their ability to deliver on growth promises. Add criteria for healthy profit margins, strong return on equity (above 15%), and manageable debt levels to ensure you’re not buying cheap stocks of troubled companies.
Consider earnings growth sustainability: Screen for companies with multiple growth drivers rather than single-product dependencies. Businesses with diversified revenue streams, expanding markets, or competitive advantages supporting their growth projections offer more reliable PEG ratio applications.
Build sector-specific watchlists: Since PEG ratios vary significantly by industry, create separate watchlists for different sectors. Technology stocks might warrant PEG ratios up to 1.5 given their growth potential.
The screening process should generate a manageable list of candidates requiring deeper fundamental analysis. Remember, PEG ratio screening is your starting point, not your ending point—each candidate needs thorough evaluation of business quality, competitive position, and management effectiveness.
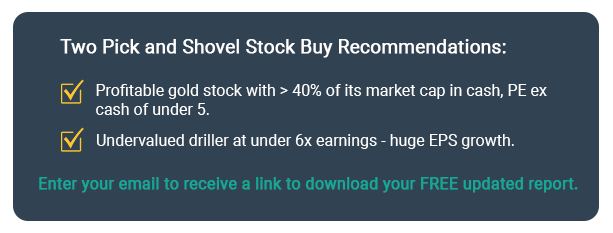
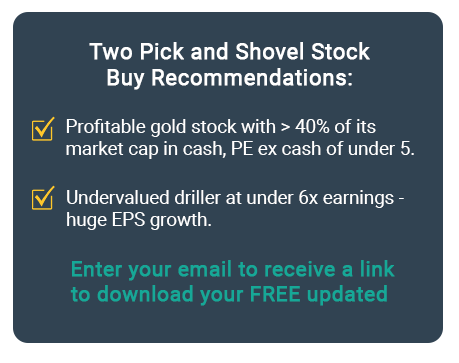
Access KeyStone’s Most Recent Update on Geodrill (GEO:TSX)
Updated GEO research report with full analysis of Q1 2025 results, new (BUY/SELL) rating, analysis, and fair value. Do not miss out!
Avoiding Common PEG Ratio Pitfalls
Despite its utility, the PEG ratio can have several limitations that can mislead unwary investors. Understanding these pitfalls prevents costly mistakes and improves your analytical precision.
Growth projection reliability represents the biggest weakness. PEG ratios depend entirely on growth estimates that may prove overly optimistic or pessimistic. Analyst projections can be wildly inaccurate, particularly for smaller companies or rapidly changing industries. Always examine the assumptions underlying growth projections and consider multiple scenarios when evaluating PEG-based opportunities.
Negative earnings create meaningless PEG ratios. When companies report losses, traditional PEG calculations become impossible or misleading. A company losing money might show negative or artificially low PEG ratios that suggest false bargains. In these situations, focus on revenue growth, cash flow trends, and path to profitability rather than earnings-based PEG calculations.
Cyclical business distortions require special attention. Companies in cyclical industries like commodities, construction, or automotive often show misleading PEG ratios at cycle peaks or troughs. A steel company might display an attractive PEG ratio during a commodity boom, but if steel prices normalize, both earnings and growth could disappoint dramatically.
One-time events can skew calculations. Asset sales, tax benefits, or restructuring charges can temporarily inflate or deflate earnings, creating misleading PEG ratios. Always use normalized earnings figures that exclude non-recurring items for more accurate PEG analysis.
Industry context matters enormously. A PEG ratio of 1.8 might be attractive in the software industry but expensive for a utility company. Compare PEG ratios within industry peer groups rather than across different sectors to avoid false comparisons.
Quality considerations remain paramount. A lower ratio means nothing if the underlying business faces existential challenges. Always evaluate management quality, competitive position, financial health, and industry dynamics alongside PEG metrics.
Your Next Steps: Putting PEG Analysis to Work
The PEG ratio offers investors a useful tool for identifying undervalued growth opportunities, but like any analytical technique, it requires disciplined application and realistic expectations. Used properly within a comprehensive GARP framework, PEG analysis can help you avoid overpaying for growth while discovering companies delivering genuine value creation.
Begin implementing PEG analysis gradually. Start by calculating PEG ratios for stocks you already own or are considering. This hands-on practice builds intuition for how the metric works across different companies and situations. Create a simple spreadsheet tracking PEG ratios alongside other key metrics for your watchlist companies.
Remember that successful investing combines analytical rigor with patience and discipline. The PEG ratio helps identify opportunities, but thorough fundamental analysis, proper diversification, and long-term perspective ultimately determine investment success.
At KeyStone Financial, we believe the best investments combine attractive growth prospects with reasonable valuations—exactly what PEG ratio analysis helps identify. While no single metric provides all the answers, the PEG ratio serves as an invaluable compass pointing toward stocks offering the optimal balance of growth and value that forms the foundation of successful long-term investing.
The next time you encounter a stock with an intimidating P/E ratio, don’t dismiss it immediately. Calculate the PEG ratio, understand the growth story, and you might discover your next great investment hiding in plain sight.
Want expert guidance finding undervalued growth stocks? Become a KeyStone client and get direct access to our top-ranked research and specific BUY recommendations each month.
