You are listening to KeyStone’s Stock Talk Podcast – Episode 304
Great to chat with you again this week. I will start with a quick look a the predictive powers of the CAPE or Cyclically Adjusted PE Ratio, AKA the Shiller PE and the relative valuation gap between Small and Large cap stocks. Brennen will answer a viewer question on the Canadian rail stocks. He will provide another great comparison of Canadian National Railway (CNR:TSX) and Canadian Pacific Kansas City Railway (CP:TSX). Brett answers a viewer question on small-cap, spec play Xtract One (XTRA:TSX), which provides an AI-powered security system of sorts. The question really break down to pure speculation versus smart investing – Brett will give you his take. Finally, Aaron will provide a summary of the “top earnings stories from last week”, including names such as Alphabet and Tesla.
Let’s get to the show – I welcome my cohost, Mr. Aaron Dunn, and the killer B’s, Brett and Brennan.
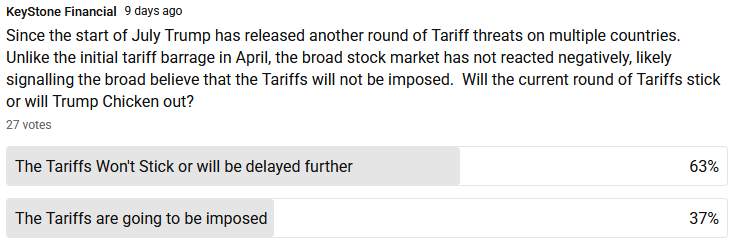
Poll Question
CAPE-tivating Predictions: Small Caps Ready to Outshine in a Pricey Market?

Just over half way into 2025, I am going to briefly look at the current broader market valuations and where the opportunities may be presenting themselves.
The CAPE – or Cyclically Adjusted Price-Earnings (CAPE) Ratio
One metric we utilize internally and quote to clients as a broad gauge of current market valuations is the CAPE ratio, also known as the Shiller PE. It is a valuation metric popularized by American economist Robert Shiller. Unlike the traditional trailing 12-month PE ratio, which can be distorted by short-term earnings fluctuations, the CAPE ratio smooths out cyclical effects by dividing the current price of an index (e.g., S&P 500) by the 10-year average of its inflation-adjusted earnings. This methodology provides a more stable and long-term view of market valuation, making it a valuable tool for forecasting potential future returns and evaluating the current valuations in a historical context.
Historically, a higher CAPE ratio has correlated with lower returns over the subsequent decade or two, as the ratio tends to revert to its mean.
As has been the case for the majority of the past decade, the S&P 500 CAPE ratio remains significantly elevated when compared to its historical averages. As of mid July 2025, the Shiller PE on the S&P 500 is 37.81. This value represents an increase from 35.2 two months ago and 34.8 one year ago, indicating continued upward movement in broad market valuation.
For historical context, the recent 20-year average for the Shiller PE ratio is 27. The current CAPE of 37.81 is approximately 40.04% higher than its 20-year average. The all-time average (over 100 years) for the Shiller PE is 17.6. The current CAPE is approximately 114.83% above its all-time historic average.
Implications of Current CAPE Levels for Future Market Returns in reality:
- The current CAPE ratio is not only significantly above its recent 20-year average but also exceeds its long-term historical arithmetic mean of 17.6 by well over 100%.
- This significant deviation implies that, based on historical patterns, the broad market could be considered overvalued.
- The core principle of the CAPE ratio is its inverse correlation with future long-term returns: a higher CAPE suggests lower returns over the next one to two decades. This indicates that investors should adjust their long-term return expectations for the broad US equity market downwards.
- Relying solely on passive index strategies such as index ETFs or funds in such a high CAPE environment may lead to subdued real returns over a multi-year horizon, necessitating a more discerning approach to portfolio construction.
Near-to mid term, it appears to be a “stock picker’s market” where identifying high-quality, fundamentally strong small and mid-cap companies can yield significant long-term returns. Recent examples include U.S small cap “picks & shovels” play on AI and Electrification, Argan Inc. (AGX: NYSE) which jumped 346.54% on record earnings. And unknown, profitable micro cap, Pro-Dex Inc. (PDEX: NASDAQ), which we recently recommending selling half original positions 18-months later at $52.52 with the shares up 180%.
The persistent elevation of the CAPE ratio has naturally led to discussions about whether structural changes in the economy, such as sustained low interest rates, the technological dominance of a few large firms, or efficient capital allocation, justify a “new normal” of higher valuations. However, the CAPE’s historical predictive power and its consistent tendency to revert to the mean suggest that such extreme deviations are historically temporary.
Updated Forward PE Ratios for US Market Capitalizations:
Comparing the updated S&P 500 forward PE of 22.48 with the S&P 600 forward PE of 15.8 reveals that large-cap stocks still trade at a significant premium of approximately 42.28% ((22.48 – 15.8) / 15.8 * 100). While this premium has narrowed slightly from the “greater than 50%” we observed in November 2023, it remains a substantial deviation from the first ~20 years of this century where small caps traded at a premium. This sustained, albeit slightly reduced, premium for large caps indicates that the underlying market dynamics favoring large-cap outperformance, such as concentrated growth and perceived safety, continue to exert influence, preventing a full mean reversion to historical small-cap premiums. The narrowing suggests some re-evaluation or rotation within the market, but the fundamental imbalance persists. The continued valuation discount in small caps implies the opportunity to position clients in high quality undervalued small caps remains.
YSOT Canadian National Railway (CNR:TSX) VS Canadian Pacific Kansas City Railway (CP:TSX) – Viewer Request
| COMPANY DATA | |
| Symbol | CNR:TSX |
| Stock Price | $131.40 |
| Market Cap | $81B |
| Dividend Yield | 2.7% |
| COMPANY DATA | |
| Symbol | CP:TSX |
| Stock Price | $105.42 |
| Market Cap | $97B |
| Dividend Yield | 0.8% |
I spoke with one of our VIP clients a week ago and they asked me if I could go through a comparison of Canadian National Railway (CNR:TSX) and Canadian Pacific Kansas City Railway (CP:TSX).
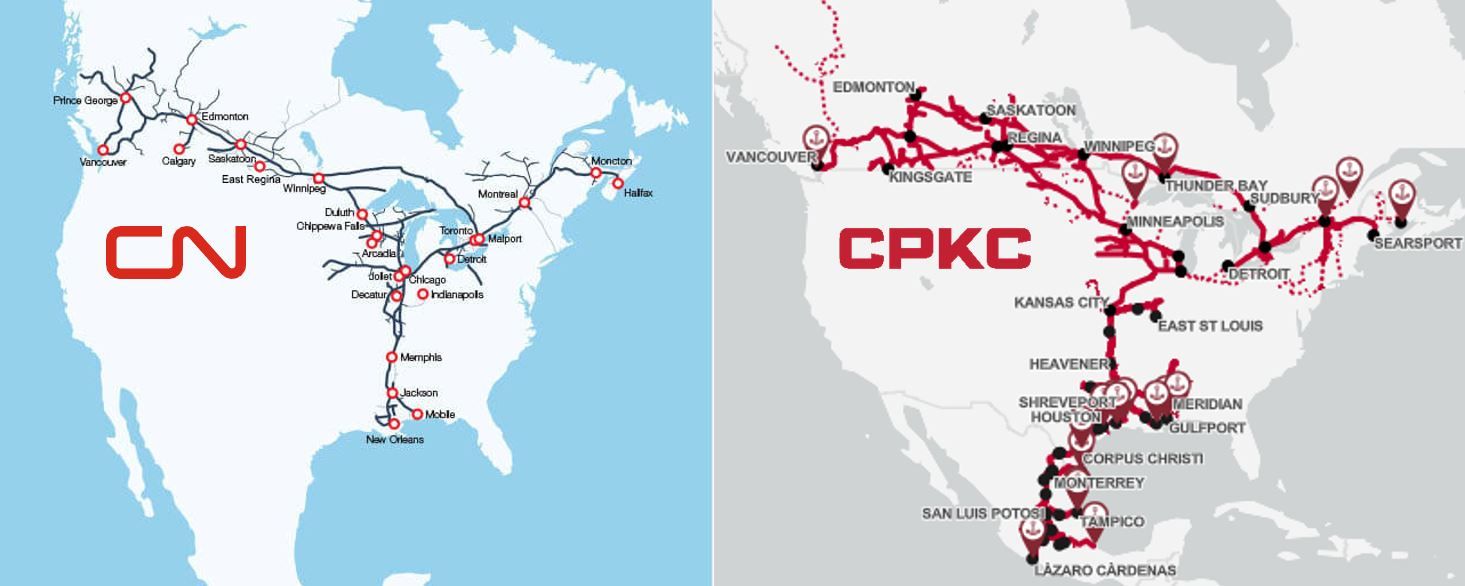
CNR engages in the rail and related transportation business and operates a network of 20,000 miles of track and 23 terminals spanning Canada and the United States. CPKC owns and operates a network of approximately 20,000 miles in Canada, the U.S. and Mexico.
Now, the last time I did a segment comparing the two was in late 2022, and this was preceding the big news that CP had officially acquired Kansas City Southern for US$31 billion.
And as a reminder, CP had initially bid on KCS in the spring of 2021 for US$29 Billion, with CN issuing its own bid of about US$34B just one month later… but the deal was blocked by the US Surface Transportation Board (STB) for anti-competitive reasons, which led to the final purchase going to CP for a few billion over its initial bid.
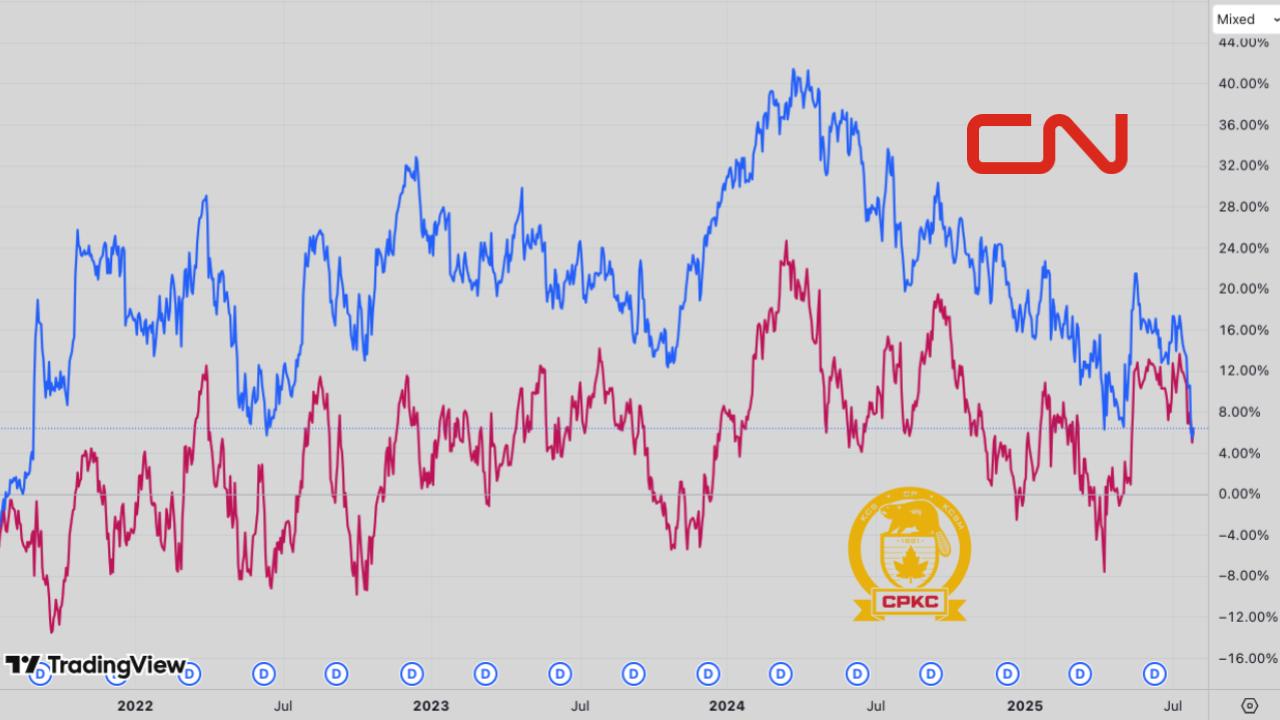
And as you can see, since the deal went through their performance has been relatively the same, up about 6%.
If we zoom in though, CNR has underperformed, down around 20% from the beginning of 2023. While CP is down just half of one percent.
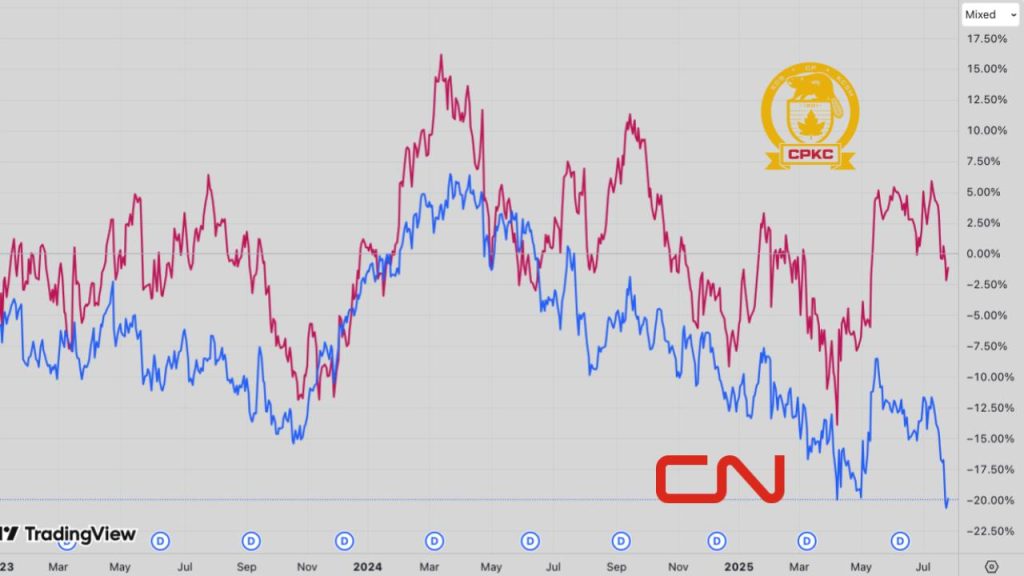
Before I move on, I will also note that CNR has continued to grow its dividend while CP hasn’t until its last dividend paid on June 27th. Plus CN has provided a better dividend yield so CN’s laggard return would be offset to some degree.
Now let’s dig into both and see why CNR has been underperforming relatively, and how both have been financially performing.
CN’s last quarter was Q2 2025 ended June 30, 2025, while CPKC’s was Q1 2025 ended March 31, 2025. So keep this in mind when we look at the numbers here, and also note that CPKC will report its Q2 results on July 30th so we can get a better like-for-like comparison after they report these results…
But we can see that CN’s revenue per product line has been hit quite hard in Q2, with year-over-year revenue down across the board… except for Grain & Fertlizers.
And if we go on a like for like basis, comparing CN’s Q1 to CP’s Q1, although CN’s Q1 was better than its Q2, CN’s revenue by products continued to be softer than CPKC’s.
Which if we look at the financials over the last 8 quarters, we can see more robust revenue growth from CPKC – likely led by better geographic exposure across North America and the integration benefits of KCR.
CPKC’s diluted EPS growth was also more robust, with CN’s diluted EPS up 7% and 8% in Q2 and Q1 respectively, due primarily to lower fuel expenses (and the elimination of the carbon tax program) while diluted EPS from CPKC was up 18% in Q1.
But Ill note that CPKC’s FCF lagged in Q1.
Moving on to the company’s FY 2025 guidance:
CN is guiding toward Revenue Ton Miles (RTM) – which is calculated by multiplying the weight of cargo transported by distance traveled – to be up in the low single digit range, while Adj. EPS is expected to be up on the Mid single-digit to High single-digit (which compares to its previous guidance of 10%-15% growth).
And looking at CPKC, it is looking toward Mid-Single Digit RTM growth, with Adj. EPS to be up 10-14%… So CPKC is looking at better growth, but again, this guidance was provided much earlier than CN’s given CPKC hasn’t reported its Q2 results yet.
Balance Sheet:
Before moving to the valuations, looking at the balance sheet – CN’s is superior with a trailing net debt to EBITDA multiple of 2.4x, while CPKC’s is around 3x.
Valuations:
And looking at the valuations, CPKC is trading at a premium across all metrics likely given its better projected growth. But following the release of its results on July 30th, we will see if they end up revising this growth lower given similar headwinds which CN is seeing.
And I will also note, that CN is trading at a historical discount on a trailing PE basis, while CPKC is trading at a premium to its historical 10 year median.
Conclusion:
Geographically CPKC is better diversified and has been producing better growth – which has led to its relative outperformance and high valuation multiples.
CN’s balance sheet is superior with a lower trailing net debt-to-EBITDA figure.
From an income investment perspective – CN is likely the better dividend growth stock, with a 2.7% dividend yield (CPKC’s is 0.8%) and has grown its dividend at a better pace. While CPKC’s has been flat with its last dividend being the first increase in 5 years.
- CPKC’s fwd Dividend Payout of 19%
- CN’s fwd Dividend Payout of 47%
From an operating standpoint, I can understand why individuals are paying up for the growth of CPKC, but it does trade at a premium valuation to its historical multiple while CN trades at a discount… but it will be interesting to review their results coming out this Wednesday (July 30th). And in my opinion both do face headwinds in the current economic environment.
CPKC has great room to grow its dividend, and its great to see that they recently increased it, but from an income perspective, CN is the better dividend growth stock.
At the end of the day I really think it’s a toss up between the two… but hopefully this provides a solid comparison for investors on the pros and cons of each.
YSOT Xtract One (XTRA:TSX) – Viewer Request
| COMPANY DATA | |
| Symbol | XTRA:TSX |
| Stock Price | $0.34 |
| Market Cap | $80M |
| Dividend Yield | N/A |
We got a question on Xtract One, and just paraphrasing their question, they have been holding the stock for years at a loss and wondering if they should double down on it. The stock has been slammed, as there have been delays in growth, but he sees a growth in backlog with a further catalyst once the one gateway hits the market with a massive total addressable market. But this is all on the back of management claiming they will hit break even in quarters, not years.
Let’s get into the company. Xtract One symbol XTRA on the TSX is a provider of an AI-powered security system to detect concealed weapons in real-time, looking to replace metal detectors, increasing patron throughput and reducing operating costs for the venue.
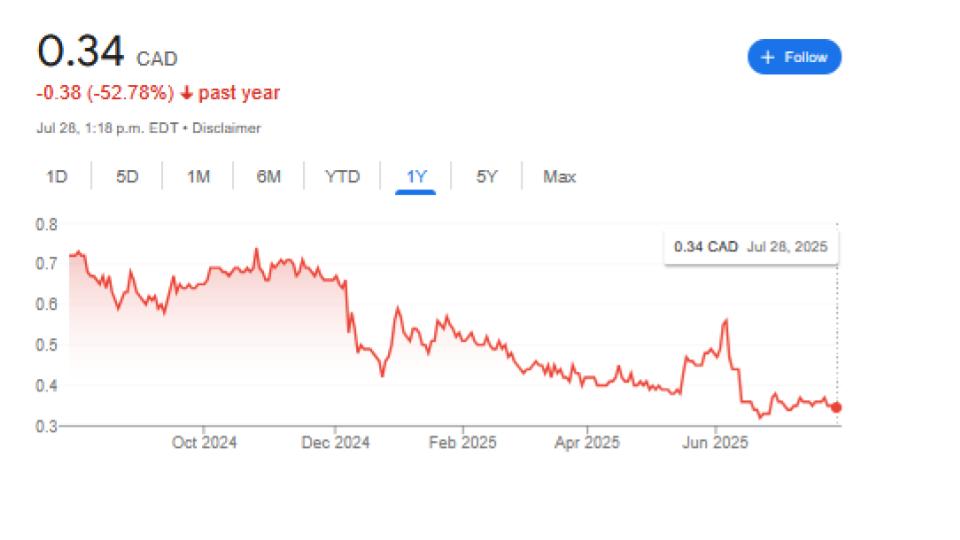
The shares are trading at $0.34, with an $80 million market cap, and are down 53% over the past year.
We’ll start with a look at the last quarter, fiscal Q3 2025 ending April 30th:
For the 3 months:
- Revenue fell 26% to $3.5 million compared to $4.7 million in the prior year, management attributing this to delayed deployments. Given the contract nature of deployments, quarter variation should be expected. About ⅔ of revenue is upfront payments, with ⅓ being subscription-based.
- And you can see the 9 months is slightly down but not to the same degree.
- But zooming out, we can see revenue has grown significantly over the past few years
- Gross profit fell 27% to $2.0 million from $2.7 million, and gross margin fell to 57% from 58%.
- Net loss decreased further to $3.1 million from a net loss of $2.7 million, or a loss of $0.02 and $0.01 per share.
- And contractual backlog increased to $15.4 million from $13.8 million.
- As well, the company noted that the Xtract One Gateway was looking to ship in July, with aggregate orders of 6.7 million across 5 customers. Which should give a bump in the coming quarters.
- As well, the company has $21.1 million in signed agreements that are pending installations.
Balance Sheet:
Shifting to the balance sheet, it is net cash. At the end of the quarter, the company held $1.9 million in cash and equivalents with no debt and leases of $1.1 million, not bad. But the balance sheet doesn’t have a ton of leeway given the company has been burning cash, with $2.2 million over the last 3 months being used for operations before working capital and $5.4 million for the past 9-months. Meaning the company needs to get more cash within the next quarter at this burn rate. Which they did.
The company raised $6.5 million after fees at $0.39 a unit, 18 million units, which includes a share and a warrant exercisable at $0.49. If the warrants are not exercised, that’s about another year of cash burn at the current rate; with the warrants exercised, that period doubles. But the shares would need to appreciate before that is likely to happen.
As you can see the chart I have up. The company has increased its share count significantly over the past few years as the company has not been profitable. And this is the issue with pre-profit companies, they do have limited time before needing to raise. The concerning part for Xtract is that the company has stated its been progressing towards cash flow breakeven since fiscal Q1 2024, and that just hasn’t materialized. Revenue has grown significantly, but the losses haven’t contracted yet.
Valuation:
Quickly, valuation, as the company isn’t profitable, we need to go off revenue, which is at 5 times trailing. This is not a super discount valuation, by any means and is supported by the expectation of significant growth, which adds further risk if growth does not materialize or at a quick enough rate.
TAM:
A quick look at the total addressable market, or TAM, as the question highlights it. The initial focus, including stadiums, theatres, event spaces, and Casino’s is $4.6 billion. With expanded TAM of $39.5 billion and global TAM of $135B, massive, but just because the market is big does not mean the company has a clear runway to billions in revenue. There
Xtract has direct competitors:
- Evolv Technology another public company EVLV on the NASDAQ, offers similar solutions, Evolv Express.
- SafePoint, which is owned by Soundthinking, symbol SSTI on the NASDAQ which also offers AI-based weapon detection solutions.
The point is that the market is competitive, and Xtract is not the only player.
Conclusion:
Overall, Xtract does not check the boxes for KeyStone at this time.
First off it’s not profitable and is still burning cash, and the gap has not trended towards closing despite management mentioning moving towards breakeven for a while now. It isn’t appearing in the financials at this time.
While the balance sheet in isolation is good, the cash burn just eats away at the capital, causing the need to raise cash through equity, which ultimately dilutes shareholders. But there is no debt burden, which is nice to see.
The One Gateway, likely having shipped or shipping in the near future, can provide a growth runwa,y which we can see in the notable backlog but with delays, could push out any potential growth further. The adoption of One Gateway will be something to follow in the coming quarters.
And circling back to the initial question, of doubling down on a losing position. Xtract doesn’t meet our GARP criteria for investment and never has, given that it is not profitable. But I will speak more generally, when looking at a company that has fallen in price, a couple of simple questions to ask are, does the company still meet your original thesis of why you invested in it, or has it broken down? If you had no position in the company already, would you invest in it?
I’ve been invested in this stock for many years, and thus, in a loss… Thinking about “doubling down”, as I believe in their (now DHS/TSA proven) tech (Smart Gateway) and their new One Gateway with unique selling points, which is about to start shipping here in July. Huge TAM, but their growth has had a setback last 3 quarters, which has disappointed the market and slaughtered the stock. IMO it all boils down to the rumour/release/delay of the One Gateway. It set the growth back (along with market/Trump/tariff turmoil etc.) but I think they are set even stronger now, once the One Gateway hits the market and starts selling. Backlog keeps growing (Saas model). They just raised cash (was a big market worry also) so they should be set now. They still proclaim “break-even within quarters, not years”. Would LOVE to hear your opinion on the case. Cheers! Lasse, Denmark
